How to rank players — towards a more accurate RL score
![]()
TL;DR: I can't really shorten the explanation, but if you're only interested in how I calculate the player rankings and not the stats discussion, you can skip straight to the headline "How I create the player ranking".
Since the release of Rocket League, a standard set of stats has been available to us: Score, Goals, Assists, Saves, and Shots. The game technically also tracks lots of other things like clears, but they were only used for the score and account stats. Over the years, there have been minor tweaks by Psyonix, but the community also developed its own measures using replays.
Some stats are just fun, while others allow us to see playstyle differences. However, the holy grail (or at least the one that generates the most eyeballs) are those that attempt to turn a player's performance into a single number. There have been many attempts at creating such a stat. Most notable: regular RL score, Octane/Shift Rating, EPM, and SPV-EBC. But what exactly do we want from such a stat, and how do we evaluate whether it's accurate?
The ideal stat
I would propose that the best imaginary stat possible would achieve the following:
- a player who averages a higher value of the stat against the same opponent is better than one with lower points average (purely based on on the pitch contribution. mental aspects can't be accounted for)
- the stat is the objective sum of all the positive and negative contributions a player makes on the field (interactions and positioning)
- the stat of the individual is independent of the results of the game (as those could theoretically be 100% at the mercy of the teammates)
Well, I did say imaginary. Realistically, we are never going to reach this, and it would be difficult to evaluate exactly how close we are to to the second point. The third point is a lovely idea, but unfortunately, we specifically need results to ever objectively evaluate anything. For example: It is clear that the team constantly placing 16th can't have the number #1, #2, and #3 players in the world. But theoretically, if someone teamed up with two plats and made the main event in EU/NA, they'd probably be the best player in the world.
Ok, so we can't achieve these exactly, but they serve as reminders of the limits that the current stats have, and we can also use them as guidelines. For example, a demolition is pretty much always a contribution, but the Rocket League score doesn't give any points for it. It's pretty much guaranteed that the default score could be improved by giving points for every demolition. How many points? Keep on reading...
How to evaluate the accuracy of performance metrics?
Without an all-knowing entity, which can tell us the objective strength of every single player, we're pretty much limited to finding correlations between the stat and something objective.
Based on our second aim for the perfect stat, we want the stat to be a sum of all positive and negative contributions from each player. That means that the sum of the stat for the winning team should be higher than that for the losing team. And if the win has a bigger margin, then the sum of the winning team should have a bigger gap to the losing team. Although, if we use goal margin as winning margin, we do run the risk of using a biased definition of bigger margin. In theory, a team could play for time as soon as they get the lead. Controlling the ball for the rest of the game while the opponents don't get a single touch. If they're capable of doing that, they've won by a big margin.
We could also apply the same idea across a larger set of games/series. We just have to make sure that the strength of the opponents is the same to keep it fair. Any round robin group stage or league would do. Across a large enough sample, you'd find that the best predictor is goal differential... duh. The problem with this evaluation, is that it specifically ignores the individual. Goals win the game, but if one player gets a goal served on a silver platter, then maybe the points should be attributed to the person who set it up. So, asserting that the winning team has more points will only make sure that we don't add fluff that doesn't help a team win. We can't use it to evaluate individuals.
What else? Well, we could just pretend for a second that analysts are objective and compare their rankings to stats. That's what someone did in this reddit post. Clearly, the analysts don't think that just being the one that scores the goals makes you the best. There is almost no correlation between goals per game and analyst ranking, but there is one for Octane rating. An r² value of 0.25 (higher means stronger correlation). Regular Rocket League score has a stronger correlation at r²=0.53. Sounds great, but turns out that those were predictions from the analysts for the Spring Major based on the spring split. Using the analysts' Winter Major post-event ratings, Hawkkn47 found a much weaker correlation, r²=0.12. Octane rating is only slightly down to r²=0.21. Estimated Plus Minus (EPM), which wasn't available on the other post, sports an r² of 0.74.
Ok, so clearly EPM is just the best? Well, it may not be quite that simple. It is actually weird to see this large difference in terms of score correlation between the two analyst rankings. Correlation measures will of course go up and down a bit on different rankings, but the massive drop from 0.53 to 0.12 cannot be explained by random variation alone. Maybe, when predicting ahead of a tournament, the analysts use generic point farming players, and once they actually see the tournament, they use a more nuanced view of the games? It seems rather unlikely that they wouldn't build a personal opinion on players prior to the major. Maybe, the analysts use the placement of the teams in their evaluation of the individuals? I'm actually pretty sure that this occurs. Even when the stats for a player on the winning team are bad, the analysts will say their positioning was great and they did everything their team needed them to do. And they may very well be right. I do not really understand why this seems to affect Octane rating less; however, the story is very clear for EPM. It actually does take into account results and strength of opponents. So it's going beyond what we want from the simple stat.
The evaluation by analysts has a couple issues.
- sample size
- ordered ranking doesn't account for skill gaps
- not objective
Are we doomed then? No, I think I have come up with a better way to evaluate player rankings that doesn't rely on biased human analysts. The solution is called: Roster Moves. A team is usually as strong as the sum of its parts. Using that assumption, we should be able to predict how strong a team will be, based on how the players performed in their previous teams. If our player ranking is more accurate, then the strength prediction for the new team is more accurate on average. Sure, you will have situations where playstyles and personalities clash, or cases like Gen.G, where everyone lifts each other up, BUT... and this is a really important but: If it's just a specific case of two friends, then it won't matter over a large enough sample size (I have thousands of rosters switches in the dataset). The better ranking will still on average be better. If it's a general trend of one player always lifting their teammates up, then that player should've been ranked higher in the first place. A player ranking which accounts for that, is a better one.
That's great and all, but that's just evaluating a player ranking. How do we use it to evaluate stats? We make a player ranking using the stats!
How I create the player ranking
If you haven't already, I highly recommend watching my video explaining the team rating AI. If you don't already have a rough understanding of how rating systems similar to Elo work, you won't understand any of the following.
As a reminder, a rating system simply gives you points when you win, and takes some away when you lose. The amount of points is dependent on the opposing team's strength relative to your own team. That is the same for the player ranking, as it is for teams. If you queue ranked in RL, the game will use the (weighted) average of the ratings from the players that make up the team. A great method for solo queuers, who play every single match with a new teammate. But if you only queue with one friend that has 100 MMR more than you, you will pretty much always stay behind them in rating. This would be a massive problem in an esports ratings system where teams stay together for a while. Imagine, a talented player gets picked up from a bubble team and doesn't have a high rating yet. Now, they'll be stuck behind their veteran teammates forever, even if they outshine them after a bit of experience. So, I'm throwing that idea out of the window and just treating players like they are their own team. Since all players on the same team win and lose and equal amount, they'll end up at the same rating once they've played together for long enough. That's the correct behaviour for now, since wins and losses cannot tell us who is the best on the team.
Now we get to the separation based on stats. The basic idea is: whenever a player wins, we multiply the points gain based on the relative stats compared to the teammates; whenever they lose, we divide the points loss by relative stats. The math is the same regardless of what stat we use. I'll use RL score for the demonstration.
- calculate the team's total score (Player A score + Player B score + Player C score)
- calculate the % of the team's total score that the player got (Player A score / Total score)
- use the percentage to scale the gain of a win
Let's do the math with a specific example to illustrate it better. Let's say Team A beats Team B and is supposed to gain +25 ranking points. For now, all our players have had the same rating, that means each individual has the same initial point calculation that the team has (+25). But the first player of Team A has averaged 400 score per game, while his teammates only got 350. The % for the first player is 400/(400+350+350) = 36%. If all players were performing the exact same, then you'd expect them to have 33.33%. 0.364/0.333 = 1.09, meaning the player overperformed by 9%. We can now just multiply the +25 * 1.09 = +27 and award the player with extra rating. The teammates will have percentages below 33.3% (31.8%) and factors below 1 (0.95). Therefore, they gain only +24 points each.
You may already notice that this makes almost no difference. We want to scale players by more than just 3 points. To do this, we can use a gamma correction. That's just a fancy term, and it basically just means we're taking the percentages to the power of gamma. If gamma = 2, then you just square the percentage: 0.364^2 = 0.364 * 0.364 = 0.132; 0.318^2 = 0.101. Now, you end up with more extreme scaling factors. Player A: +30 Player B/C: +23. The scaling factors of the 3 team members always add up to 3, to prevent inflating the total skill present on the team. When a team loses, you can do the same calculation with the inverse of the percentages (i.e. 1/0.364) to get the correct scaling factors.
The graph below visualizes the scaling factor for 3 teammates A, B, and C depending on the score they achieved in a series. The x-axis denotes the score of Player A, while Player B and C are fixed to the values of the sliders. I use a gamma value of 6 because it gives the best predictions for all the past series in the database. You can play around with the values yourself on GeoGebra. The scaling factors for the losing case can also be enabled by clicking the circles next to the functions l(x).

Once you have this system running for a while, some players will seperate themselves from their teammates. If you repeat the previous calculation in this spot, then you have to remember that each player is treated as their own team. So even if Team A is supposed to gain +25 rating points when they win against Team B, the best player on Team A is now for example 100 rating higher, and therefore will only gain +17 points by default. That player now needs a 1.5x multiplier just to get +25 points, let alone more. If they do not get that 1.5x multiplier on average, their teammates will catch up again because they're winning and losing just as often as them. Thanks to this fact, we do not have to worry about player ratings going infinitely up, just because they statistically outperform their teammates. It requires great consistency to keep a big lead for any extended period.
This method of scaling has a nice side-effect of valuing stats in meaningful games more than meaningless ones. If a team plays against a low rated team that has no chance of winning anyways, the default points gain will be very small (for example: +5). Imagine, one of the team members now farms 10 goals per game and gets a crazy score. At best they can get a 3x multiplier and get +15. A 1.5x multiplier in a +25 match will be more significant. If they're the ones that can't perform in close games, they will get significantly punished, and those other performances can't make up for it. This side-effect makes the ratings better suited for identifying players that perform well in important matches than a simple stat average.
Results
Since the data comes from the Shift dataset, I have easy access to values like Score and their Rating. So, I initially just ran my AI estimation with those two stats and looked at the results I got from that. The following is the prediction rate for newly formed teams (< 10 games): No stat scaling: 70.4% correct; Score: 71.5%; Shift Rating: 71.4%.
I need to put up a disclaimer here. It looks like stat scaling at all makes almost no difference, but that look is deceiving. I'll give you an example to illustrate the issue. One thing that will hopefully stand the test of time is Firstkiller having excellent stats. Right now, he's teamed with mist and Sypical who are ~300 rating below him. The team rating is ~2500. If mist and Sypical were to team with a 2400 player, that new team would have about ~2400 rating, compared to ~2470 rating if there was no stat scaling. There are only 3 teams in the world, where the AI would now predict a different outcome compared to previously. Being 3 spots off in your power rankings, can cause a lot of outrage on reddit, but since most teams don't play each other most weeks, it doesn't have a huge impact on most predictions. Additionally, those 3 teams are also close in skill anyways, making those predictions very volatile. That is why I actually use cross-entropy loss to evaluate the prediction quality. Loss doesn't just take into account whether the prediction is right or wrong, it also punishes the margin by which it is wrong. If you predict 51% and the team wins, that's not very good (0.96). 90% gives you a much lower loss value (0.11), but if you predict 90% and the team actually loses, the punishment is very severe (9.00). With loss, a more accurate prediction makes a difference for all matchups that a team has.
I don't like reporting the average loss, because the number has no intuitive meaning, but lower is better. The average loss with Score based scaling is a bit lower compared to Shift Rating (0.5598 vs. 0.5612). This is after tuning the gamma scaling for each stat.
That is what I had for a while, but at some point I asked myself why I didn't just try and improve on it? After all, there is more information saved in the database, such as the amount of demos a player got. Remember the question? How many points is a demo worth? It's now super simple. I just add points for each demo to the regular score and see if the predictions improve. And the end result: the best prediction happens when giving ~25-35 points per demo. Higher, and they get worse again. Not wanting to risk overfitting, I went with the lower bound of 25 points.
But why stop at just demos inflicted. I also tried subtracting points for demos taken,
but the predictions only got worse when I did. I went through all main scoreboard stats
and checked whether adjusting their value would make the predictions better. I found the
best prediction when adding 10 additional points for each goal and assist and
subtracting 15 points for every save. Saves usually reward 50 points, and epic ones even
75. Unfortunately, the data doesn't allow me to separate between the two, or I would
suspect that it's mainly the epic saves that give the player way too many points.
As
other statisticians in the past have found, goal participation is very important. 10
extra points on goals and assist seems to be the sweet spot; more would overdo it and
make the predictions worse.
I have not tried correlating with stats like average speed or time in air. They don't reward you for any specific action taken on the ball, and I therefore think it would just be rewarding specific playstyles even more than the current stats can potentially do. I am not accounting for hattricks, playmakers, etc. right now because it would require downloading each individual game from the Shift database rather than the series combined stats.
My current "better score" is this simple formula:
Score + 25 * Demos + 10 * Goals + 10 * Assists - 15 * Saves
This metric improves on the regular score by about the same margin that score predicts better than Shift rating. The predictions of newly formed teams are correct 71.8% of the time.
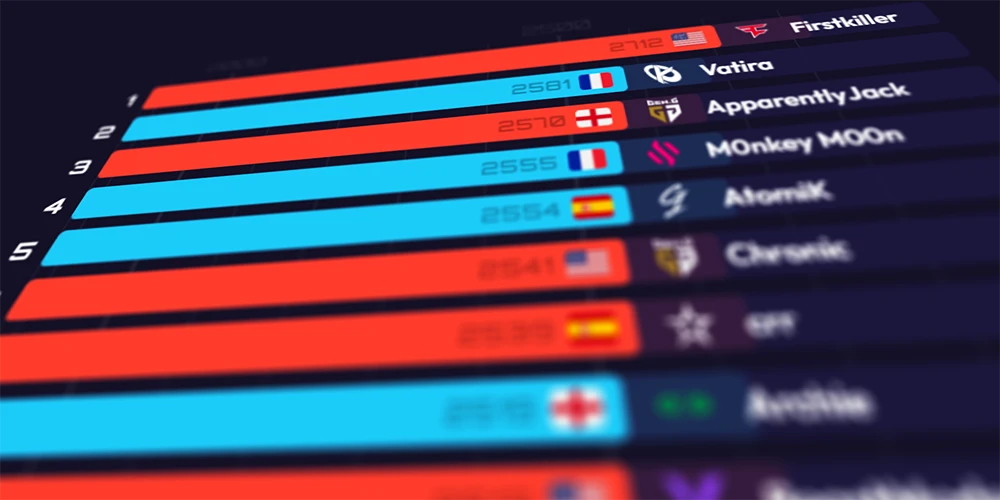
Check out the following table where I've listed the ratings using the different scaling methods. "Better score" with gamma = 6 is the default and gamma = 4 is only provided for comparison. The results are from after the 3rd Winter Split EU Regional 2023, before the 3rd NA one. Click on the bars to see the rating trend in the last regional.
Loading...
Where to go from here?
Unfortunately, the stats stored in replays are limited. However, it should be possible to get more out of them. The entire timeline of scoreboard values must be stored in the replay, as you can see them when playing it back in game, which means it should be trivial to extract the amount of ball touches. Just go through all the timesteps, and any time a player's score goes up by 2, that's an extra touch. Slightly more sophisticated tech would be needed for clears and centers, as they reward the same amount of points. But since we know which team the player belongs to and in which half the ball was when points were awarded, it should still be possible. If we had all that, we could make an even better "better score" from a completely custom mix. I'm not really sure why this stat extraction isn't being done at all. It is certainly easier just to export the final scoreboard, but Ballchasing already parses the entire replays start to finish for boost/positioning stats and heatmaps. If someone from Ballchasing reads this, it would also be cool to have average and max ping.
If Shift wants to make use of my "better score" they're obviously welcome to do so by adding it as an additional column or creating a new Shift rating. I think their rating is great for multiple reasons, especially because of the normalization portion. All stats are relative to the average pro, so you immediately know that a 1.0 performance is bang on average, while a 1.5 is a massive overperformance. By using a weighted average based on the findings of the "better score" metric, it could be just as easy to interpret while being more predictive on average.
Evaluating EPM, and SPV-EBC is unfortunately not possible right now. EPM is already a ranking in it's own right. I would
either need a large amount of tournaments rankings given to me, or I would need to know the
exact game stats it's based on. The exact formula isn't public right now.
SPV-EBC
is a machine learning based stat that attempts to evaluate player positioning and
impact. For that purpose, it needs to run every single replay through a neural network.
Right now, there is only a tiny sample size available, which is not enough to evaluate
roster moves. I'd need to have a way to run a large portion of the entire Shift database
through the positioning AI.
Limitations
The evaluation method used for these stats is objective (predicting W-L better), but it isn't all-encompassing. It only ensures that the stat accurately compares teammates to one another. So, there is a chance that "better score" may do a worse job at comparing players from winning and losing teams to one another than score. I don't necessarily think it is, but an additional evaluation would be needed to determine that.
Always keep in mind that we're evaluating based on correlations. The correlations mean that for the average pro, the ranking is accurate. The stat based scaling is this extreme because the predictions are on average the best with gamma=6. However, it's entirely possible to improve the prediction for 90% of players while making them worse for the remaining 10%. If the margin of improvement outweighs the mistakes, it will be considered better. Any specific individual could be ranked completely out of place due to their unique playstyle. For example, a player who makes many fake challenges that spill to their teammates will always get 0 points for that. In contrast, a dunk attempt will at least yield points a portion of the time. However, the important part is how often the team gains possession.
Tuning the speed
I'm fairly certain that, right now, the player rating is moving too much, too quickly. This is not based on any data, just my intuition. The overall ratings are tuned to be fast because it helps the AI make quick adjustments mid tournament. Close teams will overtake each other if one has a shaky start to the tournament while the other is popping off. However, I just can't really fathom that player skill would actually move that fast. Having a bad event is often a team issue, and if the issues are mental and not skill, they can vanish completely when joinining a new team. Unfortunately, I can't just reduce the speed at which players move around in the system without changing the teams. When you do that, you change how quickly the field spreads from one another. That is effectively deflating players relative to teams. Now, all roster moves become undervalued. So, even if the individuals are rated more accurately compared to one another, they would be inaccurately rated compared to the teams.
I have an idea regarding recent form. I might add a system that splits the evaluation into two parts. The default rating would move slow and steady, and then I'd have a separate offset that moves quickly on top of that. This component could either reset per week, per day, or whatever works out well. Or perhaps even better, the offset could decay back to 0 over time. That means it would decay upwards from negative values if a team's recent performance has been bad. I have a reason for why I haven't begun working on that yet. I might require a significant rewrite of my code. It's not impossible to add it, but I have quite a few ideas that I want to try and tack on. If I do it with the way it's set up right now, it will turn into a complete mess.
Beyond stats
Roster moves are a lovely way to evaluate players. I've recently had another idea that could potentially make the player ranking less stats dependent. Let's say we have a player who improves the personal rating of anyone who becomes their teammate. They must be making it easy to play with them, helping the team win. But the stats don't show it, so their teammates earn all the accolades. It is possible to use the movement of the teammates' rating after roster formation, as well as the inverse movement of the former teammates' rating (if they do better without you, you get punished and vice versa). The data is unfortunately pretty limited for players on teams that have stuck together for very long, but I think in the worst case, we just can't punish or reward those. It's all a matter of tuning. Again though, I definitely need to rewrite some parts first.
1v1
If you've read this far, thank you for reading! I have been asked by multiple people (including JohnnyBoi) if I'd make a 1v1 version of the leaderboard. Obviously, this would be separate from the 3v3 player ranking. Unfortunately, the Shift database doesn't contain any 1v1 show matches, and considering the rarity of 1v1 tournaments, the leaderboard wouldn't be very up to date at all. If you're interested, I could make it happen with some help. I'm down to update future matches myself, but I don't currently have the time to scrape through hours of footage and Liquipedia entries to get a big dataset of past results. I need at least a decent sized dataset to be able to properly tune the parameters, but would love to have as many matches as possible. If you are interested, don't just start noting it down though or the work might need to be done twice over. Contact me first, as there are some pretty specific datapoints that are necessary to make it compatible with the Shift data that the current AI is based on.
